For brands, growth happens from the first touchpoint to the last — it shouldn’t end simply upon the first purchase, but rather continue throughout the customer journey with the end goal of creating a lasting customer who purchases over and over again. This requires a more holistic and in-depth look at the KPIs necessary in evaluating the health of an online business. If we can identify underperforming areas of the business and improve each of those segments, brands have the ability to create impact on much larger revenue goals.
We sat down with our VP of Sales, Zach Riegle, to discuss how to reimagine the traditional funnel into a framework — what Blue Wheel calls The Performance Commerce Effect — that instead maps and measures the essential KPIs and benchmarks them against the industry standards. By reworking the traditional approach to business, brands are ultimately able to identify the areas of digital marketing that are underperforming in an effort to better sustain digital sales growth and create harmony across DTC and marketplace efforts.
Understanding your customer journey and accurately assessing your KPIs is essential for eCommerce brand growth. Yet, the challenge remains: How can brands effectively measure success and foster sustainable growth across direct-to-consumer (DTC) outlets and marketplaces?
Zach, an expert in eCommerce marketing strategies, emphasizes the need for a creative data-driven approach to content creation and KPI evaluation. This approach helps generate content that connects with the audience, leading to a more significant impact and sustainable sales growth.
Without further ado, let’s dive into the Performance Commerce Effect and how brands can apply it to evaluate and improve brand health across the entire customer journey.
What is the Performance Commerce Effect (PCE)?
Performance Commerce Effect Definition
The Performance Commerce Effect is Blue Wheel’s paradigm for evaluating success in both DTC and Marketplace businesses. By looking at every stage of the customer journey and analyzing specific KPIs within, we can measure and improve all areas of the funnel, which leads to holistic growth for your brand.
In a nutshell, it's our proven process for transforming brands across the entire omni-channel ecosystem.
How it Differs from the Traditional Funnel
Most brands view success as having a high purchase rate or a good ROAS. When analyzing the success of their paid social and search campaigns, for example, brands might look at their first-time purchase rate to gauge success — but fail to notice that those customers also have a high return rate.
As an omni-channel agency, we truly see the value in analyzing each step of the customer journey, rather than viewing them in silos. Improving your advertising audiences can result in fewer returns; engaging in email marketing can increase lifetime value.
Breaking Down the Performance Commerce Effect
Because the Performance Commerce Effect itself dives into each stage of the customer journey, it’s only right that we deeply analyze the goals, KPIs, and diagnostics of each stage to help you better understand how to improve.
PCE Stage 1: Awareness
We scroll through over 300 feet of content per day — that’s the height of the Statue of Liberty (or Big Ben if you live across the pond)! In order for your brand to make a splash, you need to stop the scroll and stand out from the constant flood of information we all experience on a daily basis.
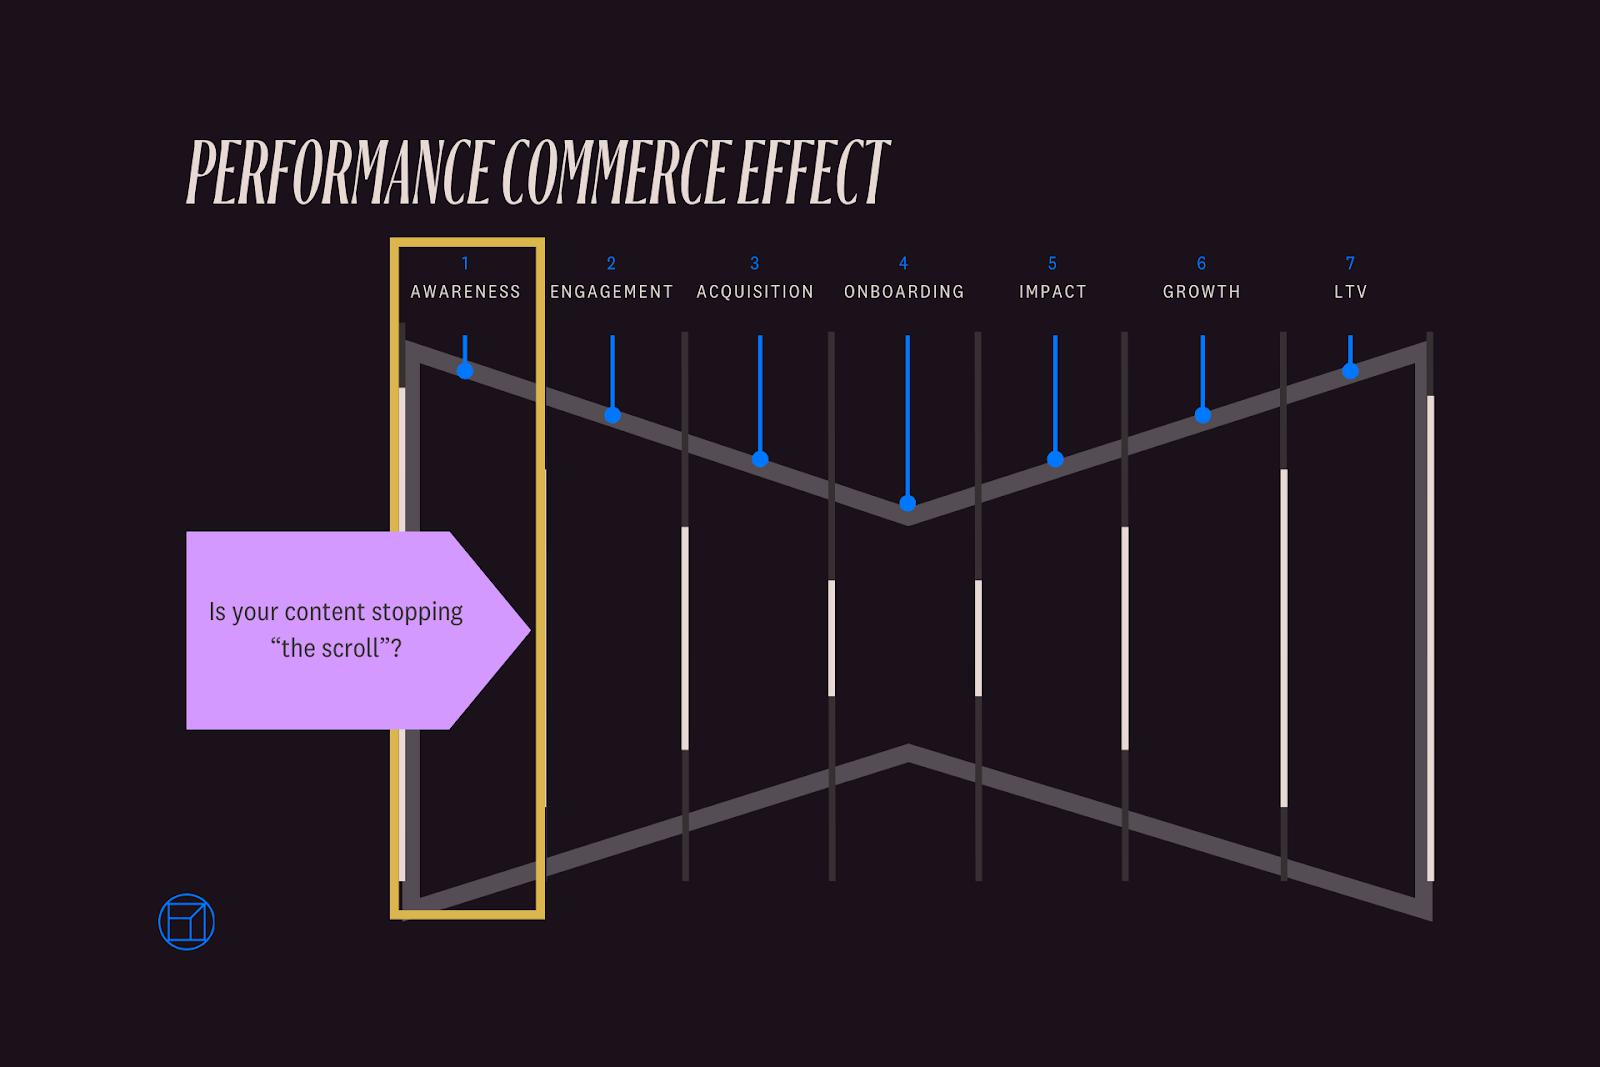
Goals
- To capture the attention of your potential customers
- Reaching a broad audience and introducing them to your brand, products, and value proposition
Tactics
- Social media advertising
- Search engine marketing
- Content marketing
- Display advertising
KPIs
- Scroll stop CVR
- Ad spend / top-line revenue
- TikTok to IG follower ratio
- CPM
Diagnostics
Our goal for CPM is around $20. If your CPM is drastically low, you’ll likely see that your clickthrough rate (CTR), conversion rate (CVR), and cost per landing page view are underperforming because you’re not driving qualified traffic. If your CPM is too high, you’re too specific.
The goal for our scroll stop is to be above 15%. This includes people who watch more than 3 seconds of a video or click through.
For topline revenue reinvested, we want to reinvest around 30%. If you’re in growth mode, you might reinvest 35% or more; if you’re in profitability mode, you might reinvest 10–20%.
PCE Stage 2: Engagement
Once you have their attention, what are you doing to win that engagement in the form of a click? Does that click result in a session on the site? Educational content does well here to establish your brand’s authority and move potential customers towards conversion. You need to give them a reason to click through.
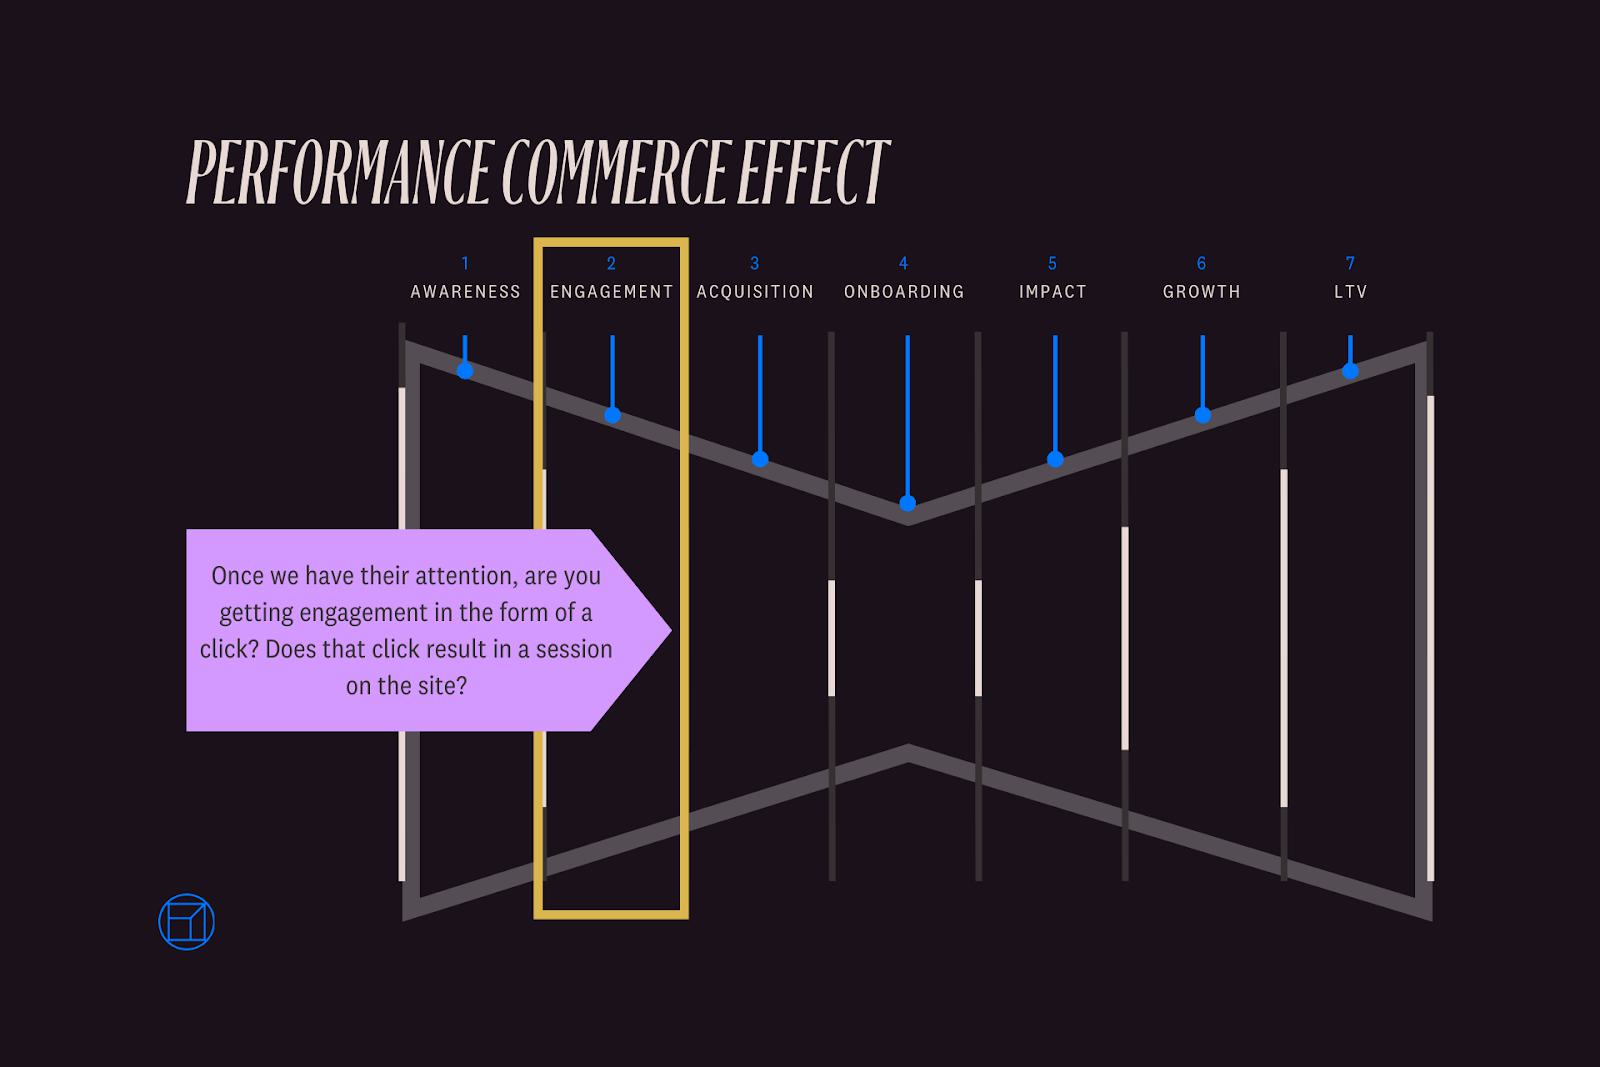
Goals
- To nurture potential customers as they evaluate your brand
- Focus on personalized communication to influence their decision process
Tactics
- Email marketing
- Educational videos
- Social posts
KPIs
- Cost per click (CPC)
- Clickthrough rate (CTR)
- Cost per landing page view (CPLPV)
Diagnostics
The current benchmark we’re seeing for CPC is around $1.58. Metrics higher than that could mean you’re not reaching the right audiences.
For Cost per landing page view (CPLPV), we look at the number of times a landing page has been loaded — so if someone accidentally clicks your ad link but then exits out before the page actually loads, it doesn’t count, giving you additional insight beyond CTR.
Targeting, creative, and messaging all play into the numbers here. If you’re seeing these numbers below benchmark, consider shifting those assets first.
PCE Stage 3: Acquisition
This is where the rubber meets the road — where conversion happens and purchases are made. If there are no purchases, you need to eliminate friction to acquire that customer.
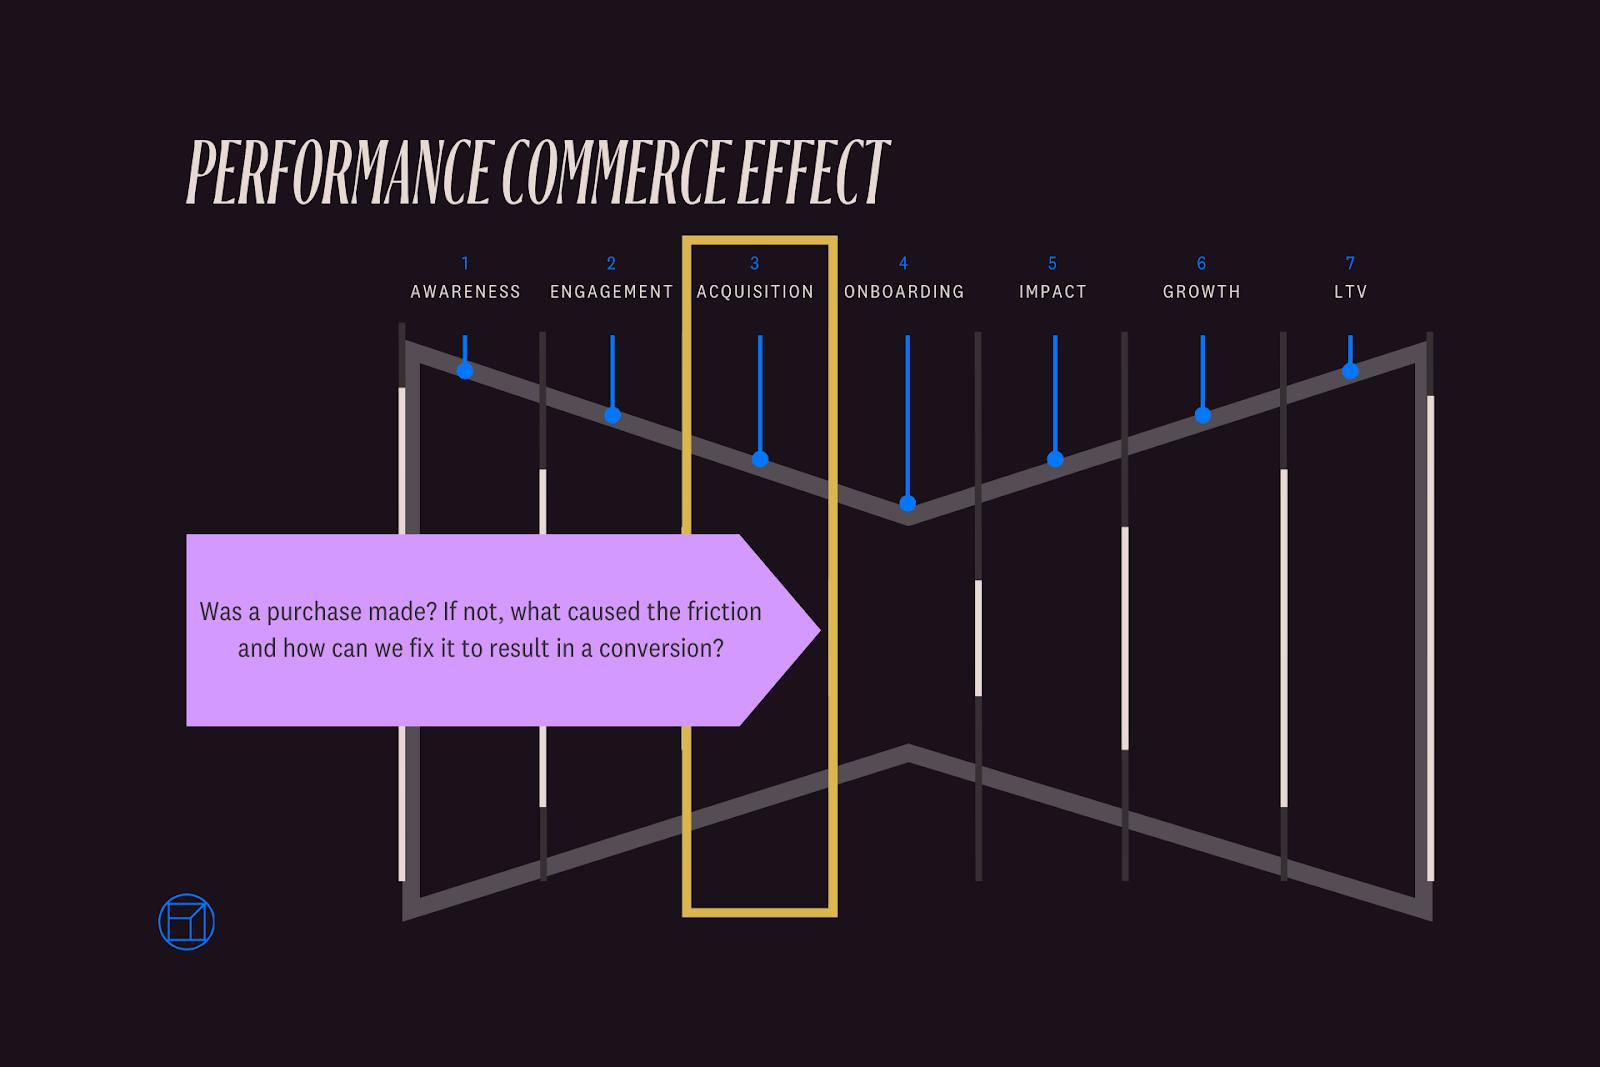
Goals
- To facilitate a smooth purchasing experience
- Drive potential customers to conversion
Tactics
- Evaluate conversion rates to better understand the driving factors of your customer’s purchase decision
- Uncover friction a customer faces when they don’t purchase
KPIs
- Revenue driven from ads
- First-time purchase rate
- Cost-per-acquisition (CPA)
- Average order value (AOV)
Diagnostics
First, we need to look at the AOV to CPA rate. Our benchmark is 2.7, which is a good number to shoot for here.
Next, we look at the percent of revenue that’s driven from advertising. This is essentially the inverse of the previous number we looked at. We want it to be around 39%, because brands should have a steady stream of revenue coming in from influencer partnerships, organic social, PR. If this percentage is too high (above 60%), that’s an indication that something’s not sticking, and other areas of the business need to improve to have an overall healthy brand.
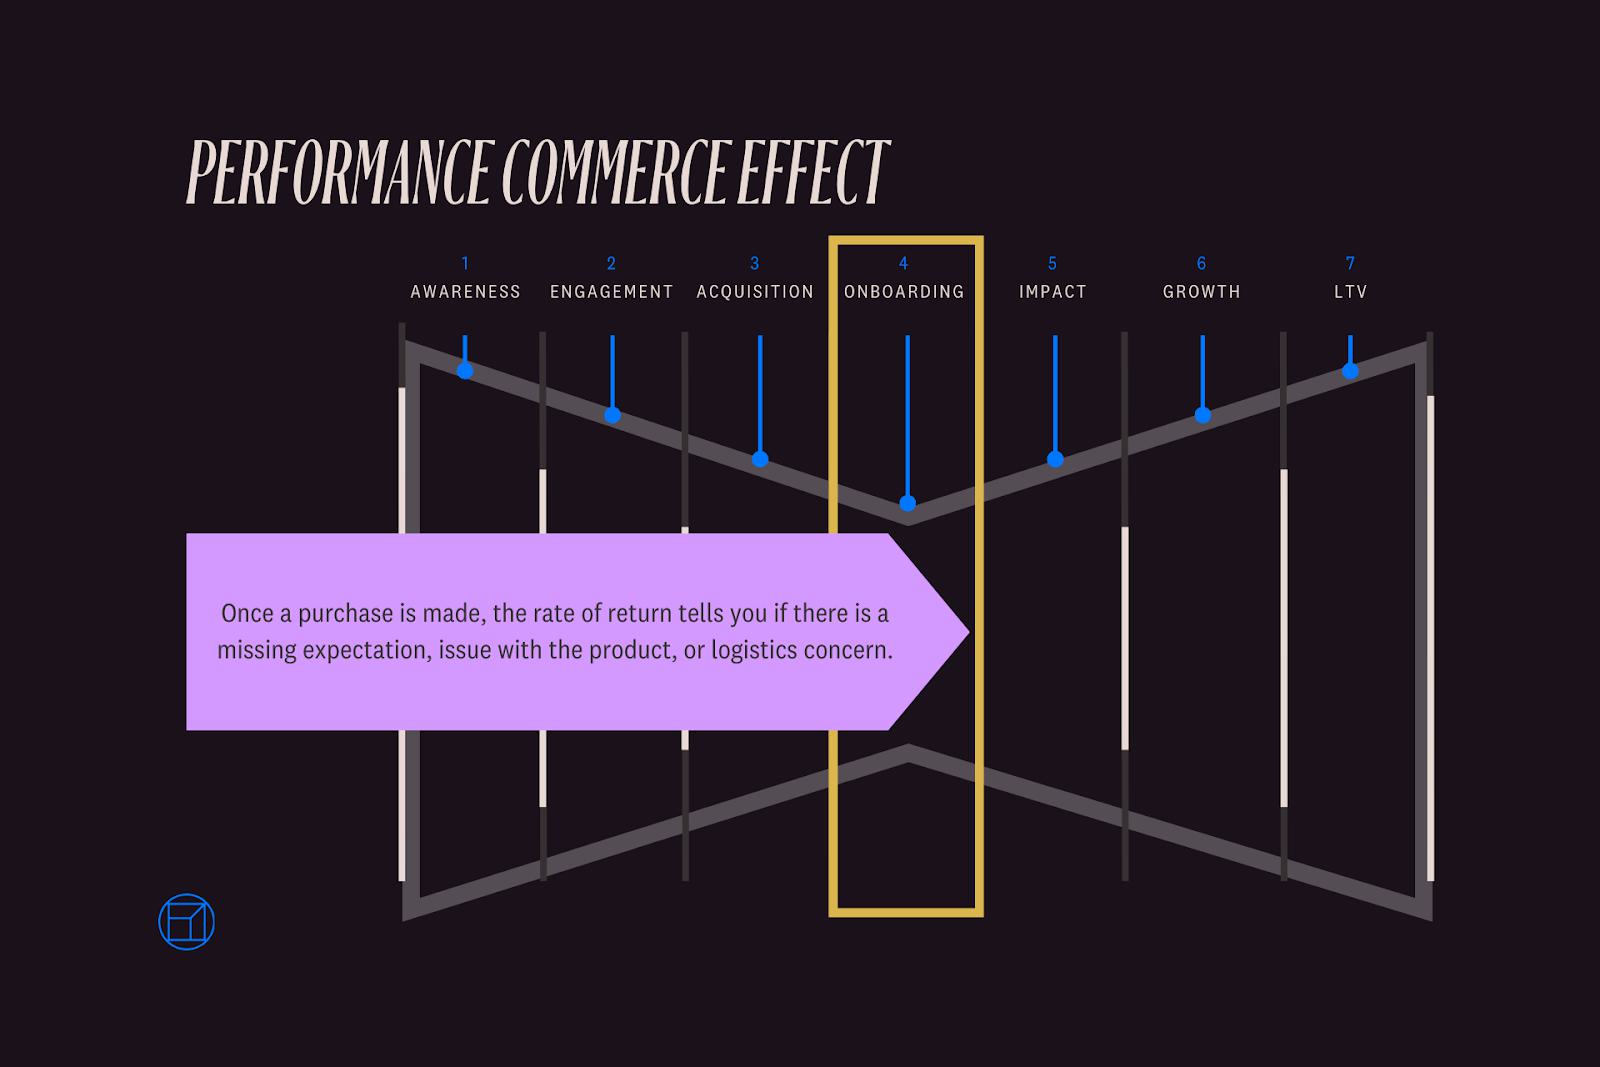
PCE Stage 4: Onboarding
Once a purchase is made, the rate of return tells you if there is a missing expectation, issue with the product, or logistics concern. This is why it’s absolutely critical for advertising teams to be in constant contact with other teams, such as back-end operations and product developers.
Goals
- To ensure customers receive premium service after purchase
Tactics
- Analyze post-purchase experience, from checkout to received product
- Evaluate return rates to identify potential problems
KPIs
- Product return rate
- Return reason
- Deliverability rate
- Cancel rate
Diagnostics
Your return rate should be at or less than 9%. Anything higher than that indicates there could be an issue with what the customer expected to receive, a faulty product, or a shipping delay. Or, it could be an issue with your audience — perhaps the wrong type of person received the product.
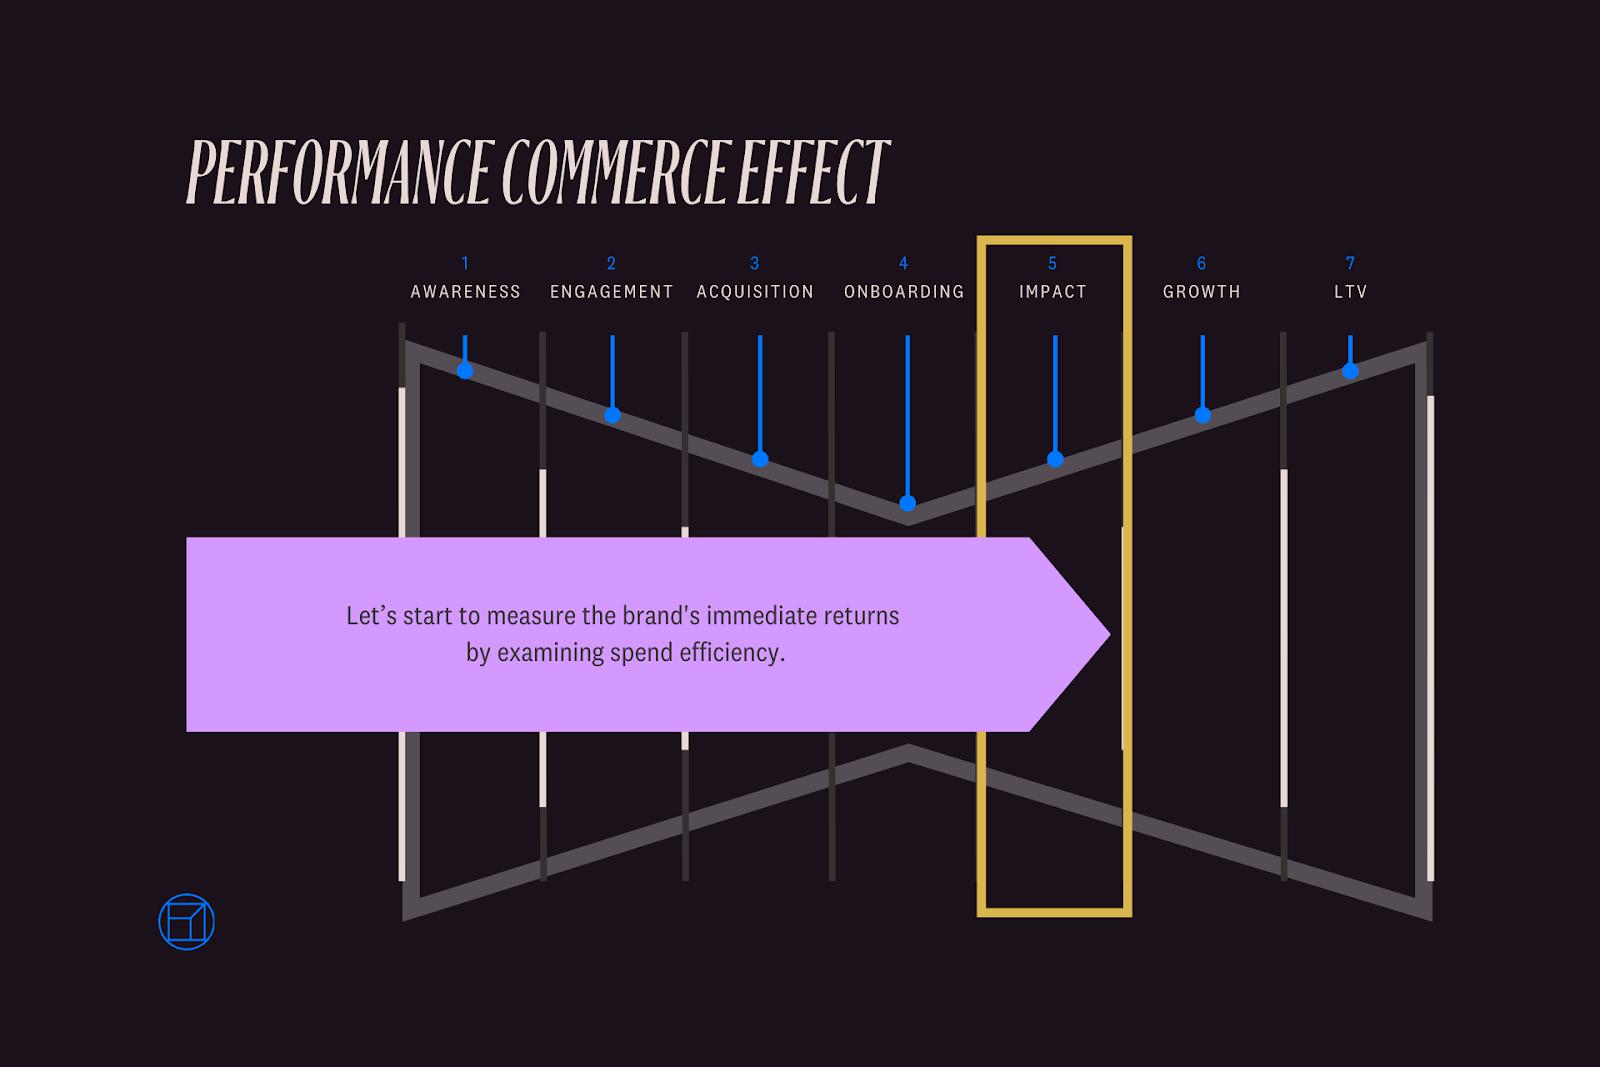
PCE Stage 5: Impact
This stage is where we measure the brand’s immediate returns by examining spend efficiency. Most brands want to know the ROAS of their campaigns, because that’s what your board/CEO/CMO cares about. But, as you’ve hopefully gathered, the data analysis should not just be ROAS.
Goals
- To measure immediate investment by examining spend to revenue efficiency
- Evaluate ROI
Tactics
- Measure spend and resource allocation to revenue across all platforms
KPIs
- Media efficiency ratio (MER)
- Blended ROAS
- Conversion rate
Diagnostics
Your MER should be at or around 5.6, which is our typical benchmark. This includes all of your revenue divided by all of your spend.
On the other hand, your blended ROAS should be at 2.01. Blended ROAS doesn’t just look at last-click; it also looks at all of the channels and how they impact the customer journey.
If we’re looking at the Amazon advertising side, this is where we would look at ACOS and TACOS with a similar mindset.
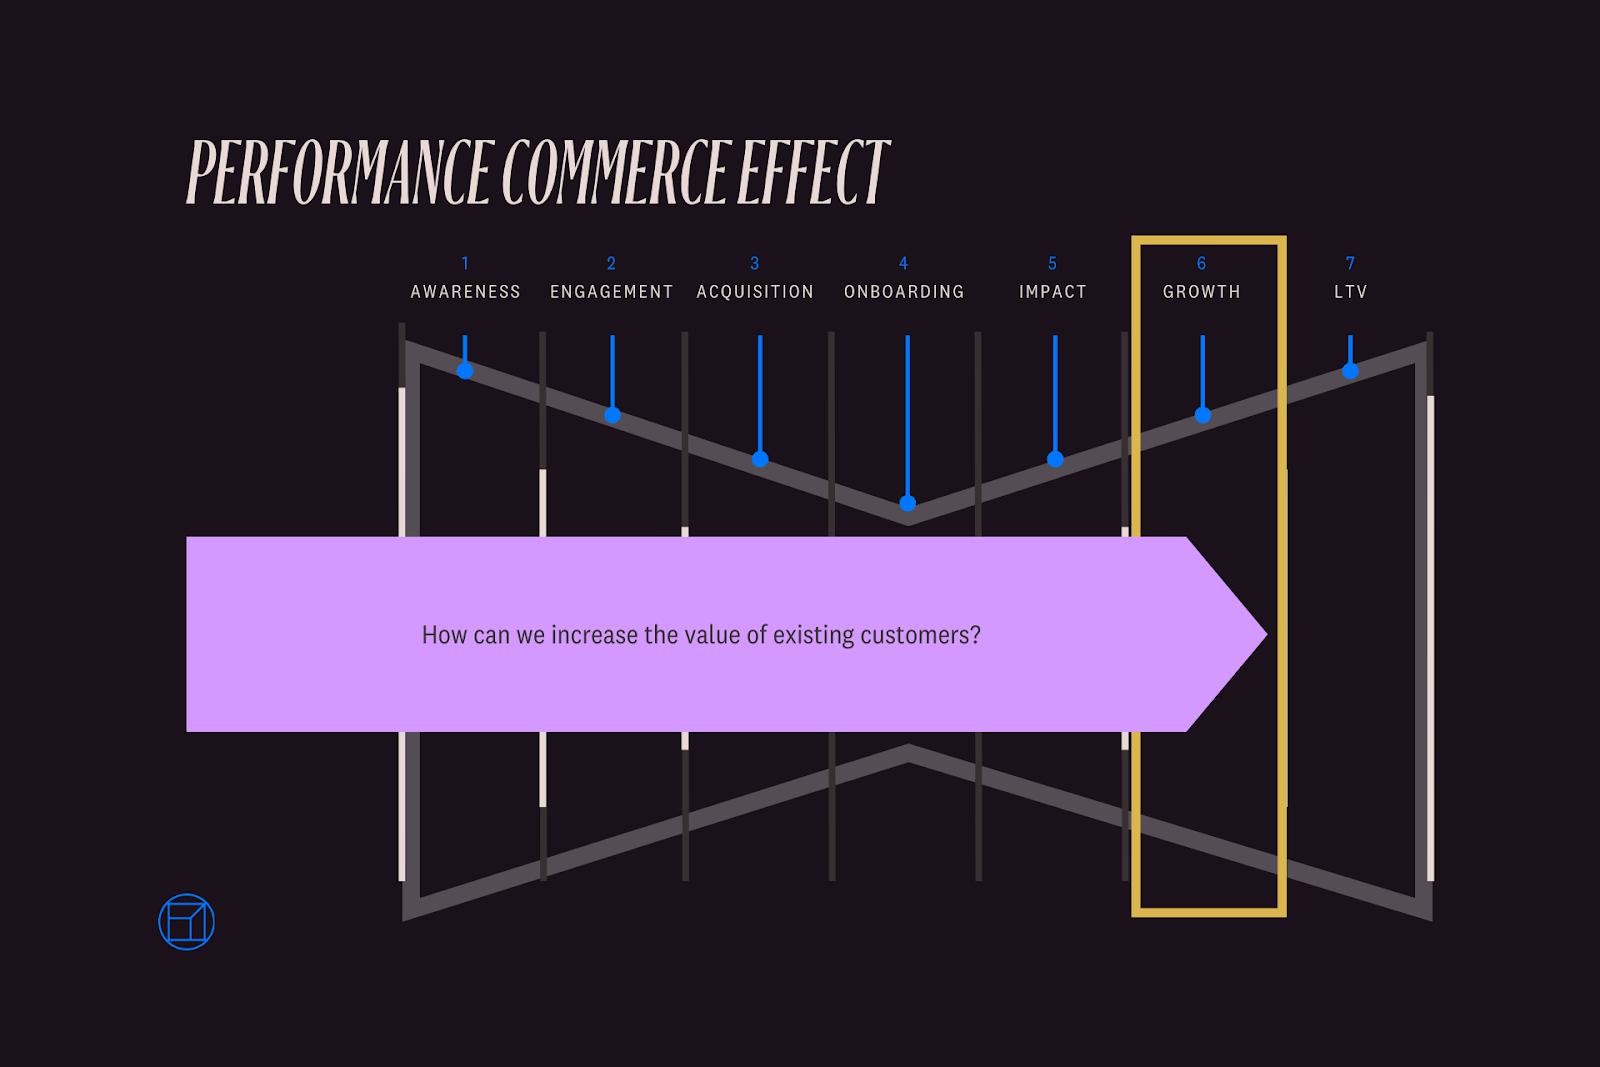
PCE Stage 6: Growth
This stage of the bowtie funnel is where your brand can really see explosive growth — hence the name! Everyone knows that it’s cheaper to retain and re-convert an existing customer than it is to acquire new customers, so you should be very focused on keeping your email subscribers and social followers engaged.
Goals
- To nurture an existing customer relationship
- Encourage repeat purchases
Tactics
- Strategize and implement post-purchase tactics
- Email campaigns, retargeting ads, reminder text messages, and upsell promotional campaigns
KPIs
- Revenue driven from email
- Subscription and loyalty
- Topline revenue growth
Diagnostics
30% of your DTC revenue should come from email marketing. Of that 30%, we want 25–30% to be driven from automated drip emails based on replenishment or site behavior.
Encouraging customers to enroll in a subscription or loyalty program is a great way to keep them engaged and provide benefits to your loyal customers. This is currently trending at around 2.68%, which is a good benchmark for success.
Lastly, you should look at how your company is growing overall by looking at topline revenue growth. Are all pieces contributing to this overall company growth?
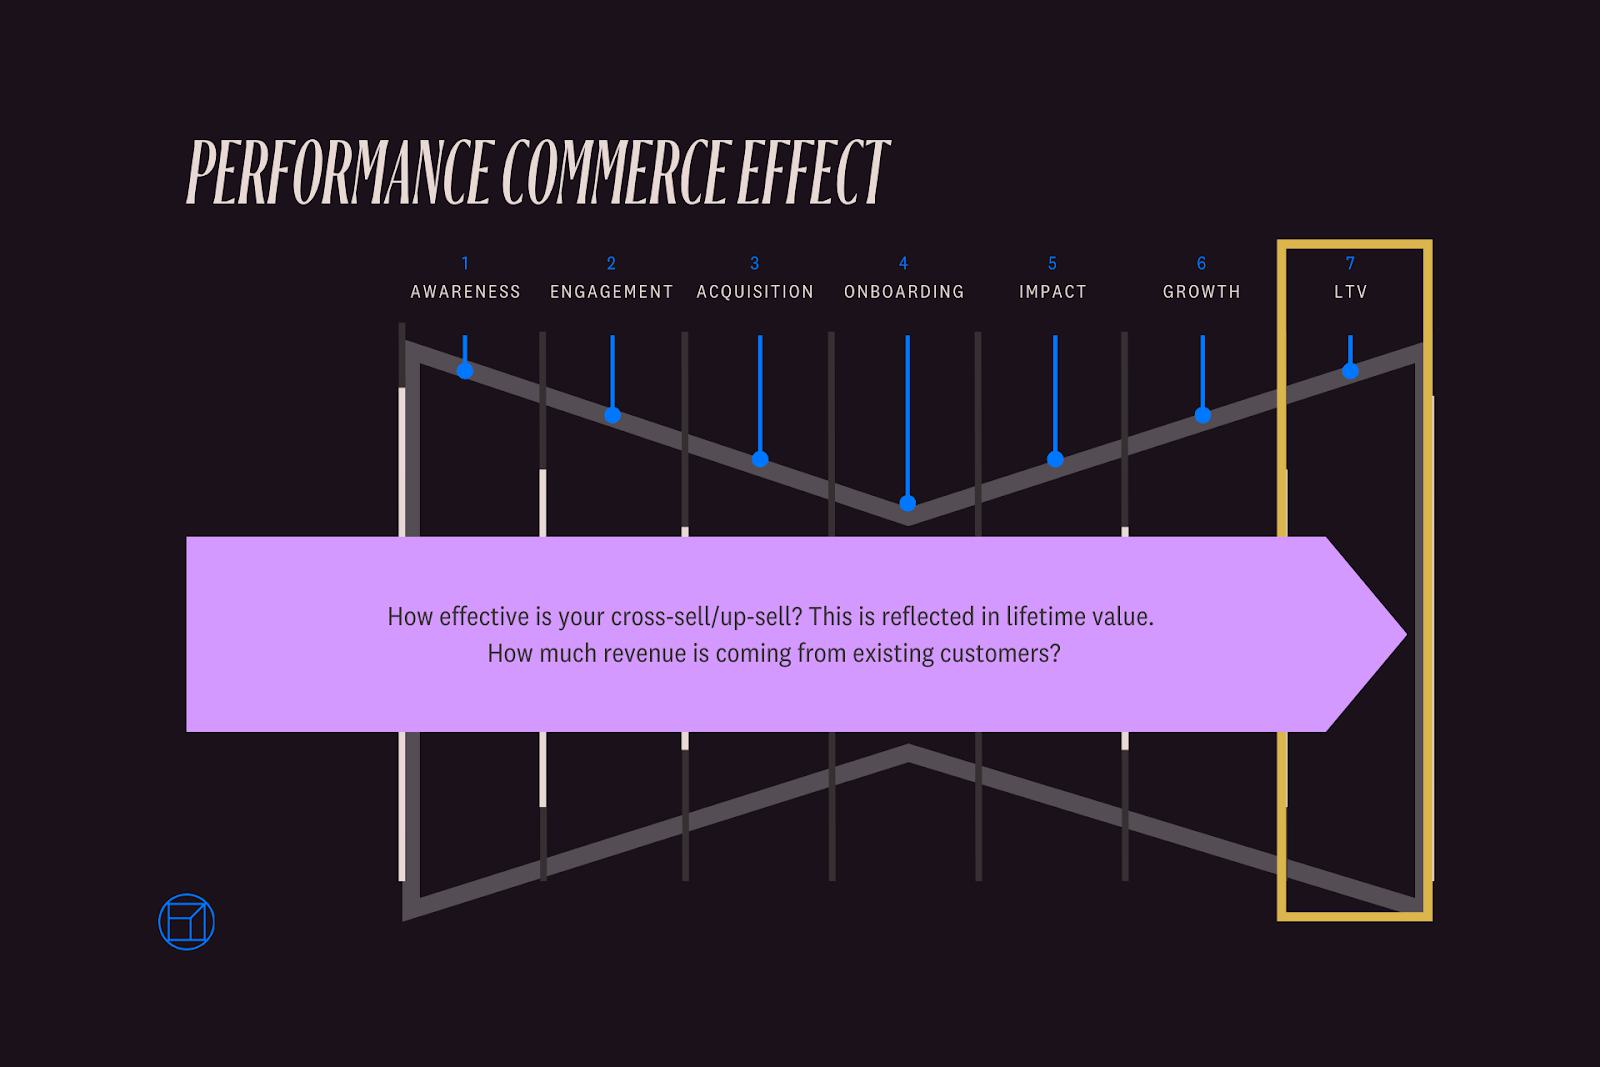
PCE Stage 7: Lifetime Value (LTV)
Growing your customer’s lifetime value is key to scaling a healthy business. Your cross-selling and up-selling tactics should be monitored for effectiveness. The amount of revenue coming from existing customers can reveal a lot about the overall health of your brand and the satisfaction of your customers.
Goals
- To evaluate the value of an existing customer over time
Tactics
- Uncover satisfied customers and make them brand advocates
- Find long-term solutions to encourage repeat purchases, recommend your brand to friends, engage in your social platforms, and leave reviews
KPIs
- Lifetime value (LTV) / new customer acquisition cost (CAC) ratio
- Repeat purchase rate
- Total orders / total customers
Diagnostics
The new CAC benchmark is 4.96. Your brand should be aiming for this in order to maintain profitability in the long term.
Repeat purchases should be around 35%. If your brand sees a lower rate than that, you are likely needing to focus more effort on new customer acquisition.
How We Evaluate Brand Health with Performance Commerce Effect
Blue Wheel’s method of evaluating brand health is based on the Performance Commerce Effect. When we audit brands, we take a deep dive into each of these stages of the funnel to get a full picture of their business.
Hopefully, as you’ve learned now, ROAS is not the end-all-be-all stat we often think it is. Of course, it’s important, but the health of your brand is impacted by so much more than just one statistic.
We always encourage brands to take small steps to improve each of these areas. Increasing one of these pieces by just 10% can allow you to impact much larger revenue goals. Fixing everything all at once can lead to inconsistent data or unimpressive results, but working to improve one area at a time allows you to let the data speak for itself.
Lastly, let each of the areas inform other areas. For example, if you have a high return rate, you should investigate your advertising audiences, creative messaging, and shipping times. You might find that one (or all) of these areas was leading to a disconnect between you and the customer. Solving just one of these at a time allows you to make big changes with little effort.
Interested in learning more about the PCE? Watch our recent webinar focusing on The Performance Commerce Effect.
Want to see the Performance Commerce Effect in action for your brand? Reach out to Zach and his team today to evaluate your brand health.
Hannah Hansen
Hannah Hansen is a freelance copywriter and brand designer. She's passionate about distilling complex ideas, crafting brand narratives, and making good design accessible to all. She currently lives in Oceanside, California, with her husband and their golden retriever.